NPS vs CSAT vs CES: which customer feedback metric should you use?
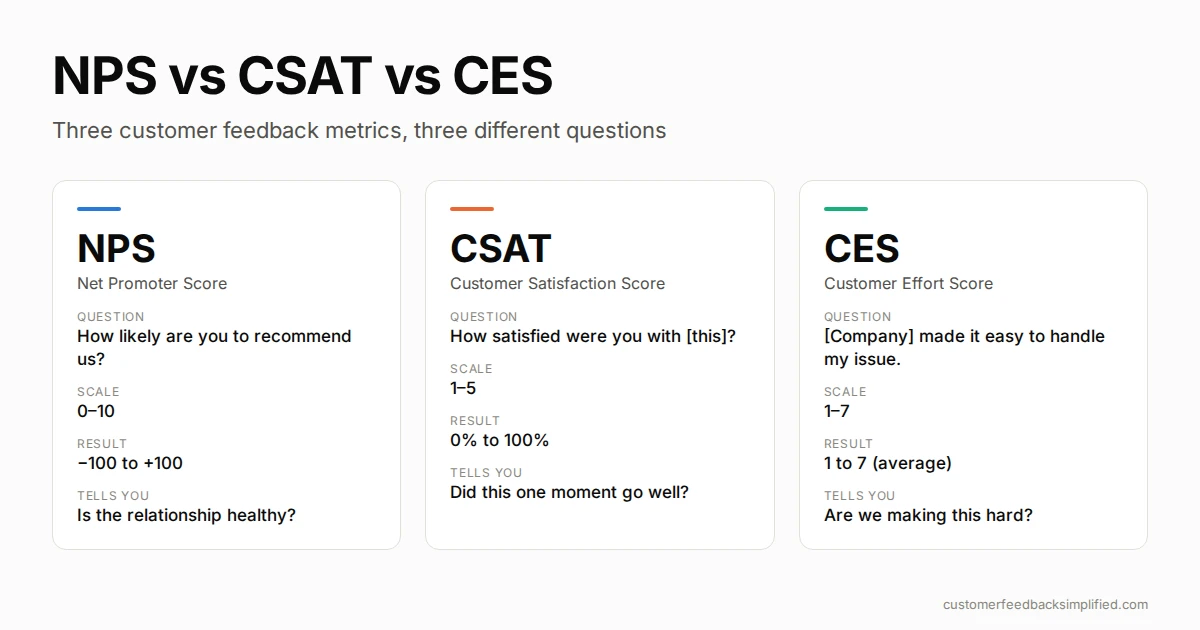
NPS, CSAT and CES all measure customer sentiment, but they answer three different questions.
- NPS (Net Promoter Score) measures loyalty — would they recommend you?
- CSAT (Customer Satisfaction Score) measures happiness with one specific thing — a purchase, a support ticket, a stay.
- CES (Customer Effort Score) measures friction — how hard did they have to work?
Use NPS to track relationship health over time. Use CSAT immediately after a transaction. Use CES after any interaction where effort was involved. Most businesses that measure well use all three, at different moments.
Quick comparison
| NPS | CSAT | CES | |
|---|---|---|---|
| Measures | Loyalty and advocacy | Satisfaction with a specific experience | Effort required of the customer |
| The question | “How likely are you to recommend us to a friend or colleague?” | “How satisfied were you with [X]?” | “[Company] made it easy for me to handle my issue.” |
| Scale | 0–10 | 1–5 (sometimes 1–7) | 1–7 agreement scale |
| Result range | −100 to +100 | 0% to 100% | 1 to 7 |
| Best timed | Periodically — quarterly, or 30–90 days after onboarding | Right after a transaction | Right after a support or service interaction |
| Answers | “Is our relationship healthy?” | “Did we get that one thing right?” | “Are we making this hard?” |
| Predicts | Referrals, long-term growth | Short-term repeat business | Churn and repeat contacts |
| Weakness | Slow to move, no detail on why | Inflated by polite responses | Only applies to effortful moments |
1. NPS — Net Promoter Score
What it measures
Whether customers like you enough to put their own reputation behind a recommendation. Developed by Frederick Reichheld at Bain & Company and introduced in Harvard Business Review in 2003.
The question
“On a scale of 0 to 10, how likely are you to recommend us to a friend or colleague?”
How to calculate NPS
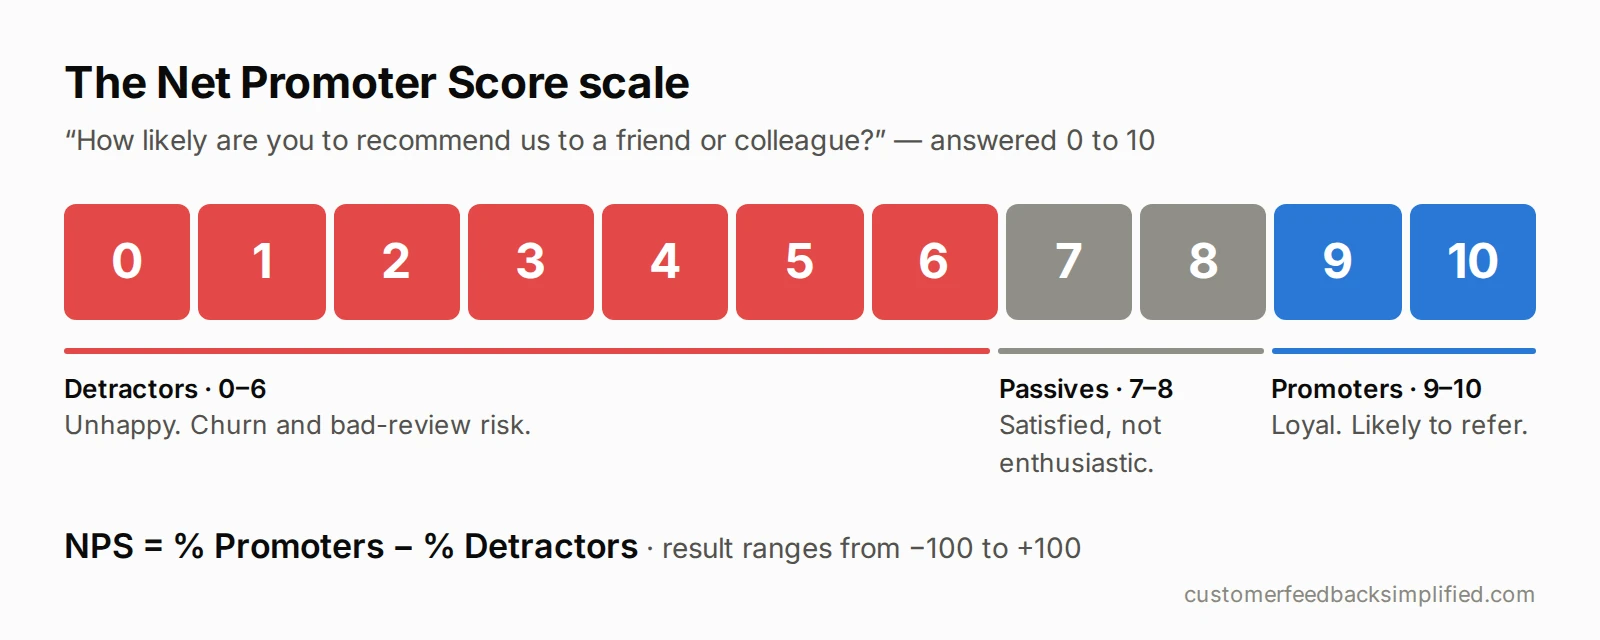
Sort every response into three groups:
- Promoters — scored 9 or 10. Loyal, likely to refer.
- Passives — scored 7 or 8. Satisfied but not enthusiastic. Counted in the total, but not in the formula.
- Detractors — scored 0 to 6. Unhappy, and a churn and bad-review risk.
Worked example. You collect 200 responses:
- 120 Promoters → 120 ÷ 200 = 60%
- 40 Passives → 20% (not used in the formula)
- 40 Detractors → 40 ÷ 200 = 20%
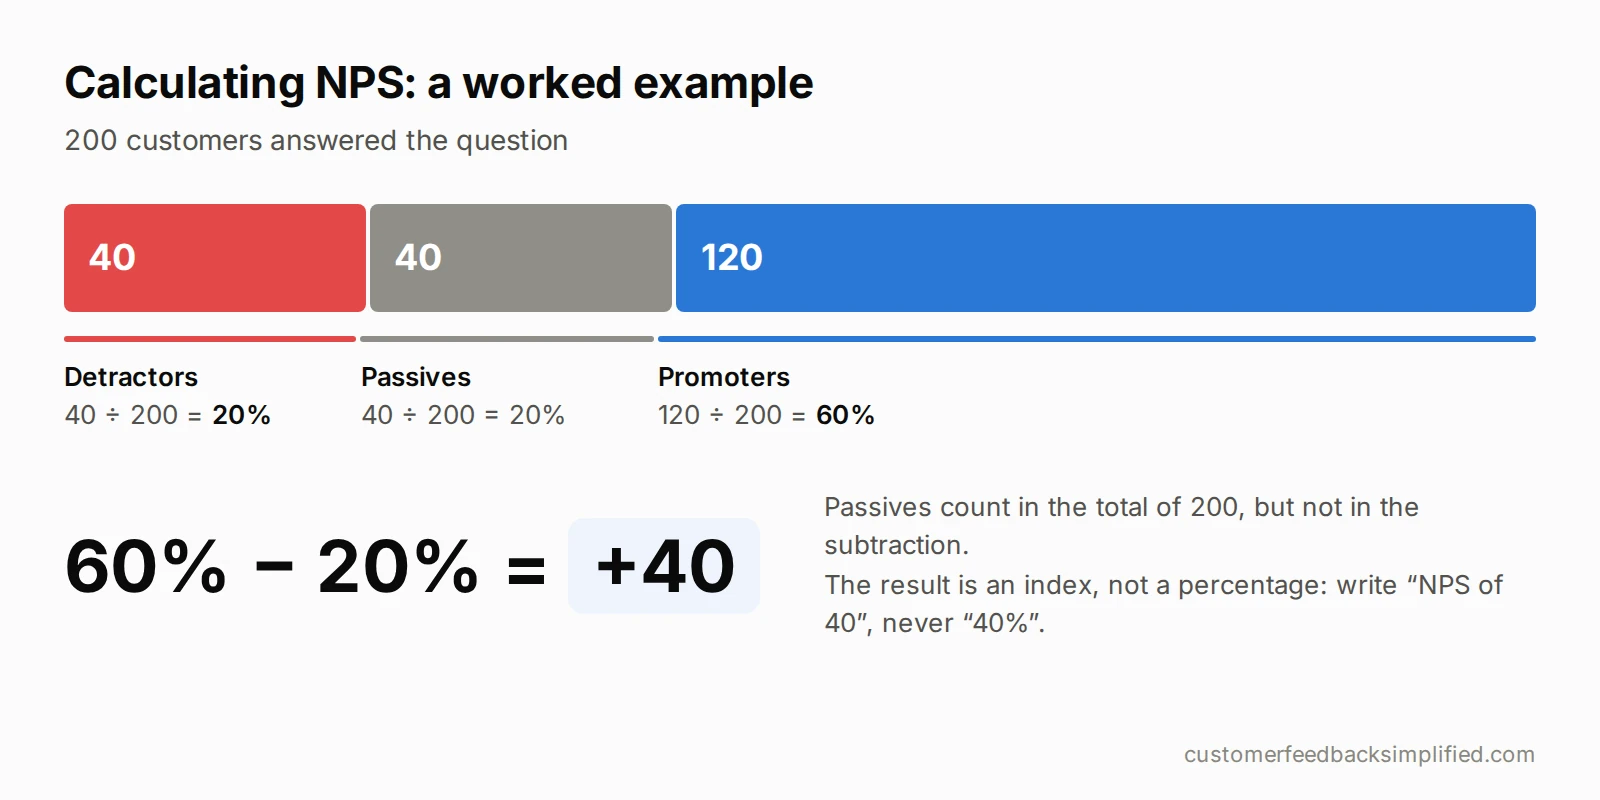
The result is a whole number between −100 and +100, not a percentage. Write it as “our NPS is 40”, never “40%”.
What is a good NPS score?
As a general rule:
| Score | Reading |
|---|---|
| Below 0 | More detractors than promoters — something is structurally wrong |
| 0 to 30 | Good, with clear room to improve |
| Above 30 | Strong |
| Above 70 | Exceptional — customers actively advocate for you |
But industry matters more than the absolute number. From Retently’s 2026 benchmark data (minimum 10,000 surveys per industry):
| Industry | Average NPS |
|---|---|
| Financial Services | 68 |
| Consulting | 68 |
| Technology & Services | 63 |
| Ecommerce & Retail | 61 |
| Digital Marketing Agencies | 49 |
| Property Management | 47 |
| Insurance | 46 |
| Logistics & Transportation | 42 |
| Construction | 42 |
| B2B Software & SaaS | 41 |
| Communication & Media | 39 |
| Healthcare | 37 |
| Cloud & Hosting | 30 |
| Internet Software & Services | 26 |
An NPS of 35 is below average for ecommerce and well above average for cloud hosting. Compare against your own trend line first, your industry second.
When to use NPS
Use it for the relationship, not the transaction. Send it quarterly, or 30–90 days after onboarding — long enough that the customer has formed a real opinion. Asking immediately after a purchase measures excitement, not loyalty.
Always pair the score with one open follow-up: “What’s the main reason for your score?” The number tells you there is a problem. The comment tells you what it is.
2. CSAT — Customer Satisfaction Score
What it measures
How satisfied someone was with one specific interaction. The narrowest and most immediate of the three.
The question
“How satisfied were you with [your recent order / your support experience / your stay]?”
Answered on a 1–5 scale, where 1 is very dissatisfied and 5 is very satisfied.
How to calculate CSAT
Count only the top two ratings — 4 and 5 — as satisfied.
Worked example. 300 responses:
- 90 rated 5
- 120 rated 4
- 50 rated 3
- 25 rated 2
- 15 rated 1
CSAT = (210 ÷ 300) × 100 = 70%
Note what the “top two” convention does: a 3 counts as a failure. That is deliberate — neutral customers behave much more like dissatisfied ones than satisfied ones.
What is a good CSAT score?
There is no cross-industry CSAT benchmark worth quoting, and this page is not going to invent one. You will find a “75–85% is healthy” range repeated across the web with no study behind it.
The reason a single figure misleads is that CSAT depends heavily on what you asked about and when. Post-purchase CSAT and post-support CSAT, in the same business, on the same 5-point scale, routinely land far apart — the second is measured on people who had a problem. Two things are safe to do instead:
- Compare against yourself. The same question, at the same touchpoint, against last period. That comparison is valid on day one and needs no benchmark at all.
- For a sector figure, use the ACSI. The American Customer Satisfaction Index publishes scores by industry on a methodology it documents. Note that it is a 0–100 index built from its own model, not the top-two-box percentage described above — the two are not interchangeable and do not belong on the same chart.
When to use CSAT
Immediately after a defined event, while it is fresh: order delivered, ticket closed, meal finished, checkout completed. Response rates fall away quickly once the moment has passed — which is why the timing matters more in some businesses than others. A restaurant has one usable window, at the table; a hotel has check-out; a school works to a term, not a transaction.
CSAT is the right metric when you want to know whether a specific process is working. It is the wrong metric for judging the overall relationship — a customer can be delighted with Tuesday’s support ticket and still be planning to leave.
3. CES — Customer Effort Score
What it measures
How much work the customer had to do. Introduced by the Corporate Executive Board — Matthew Dixon, Karen Freeman and Nick Toman — in the 2010 Harvard Business Review article “Stop Trying to Delight Your Customers”, based on a study of more than 75,000 customer interactions.
Their central finding was counterintuitive: exceeding expectations barely moves loyalty. Reducing effort moves it a lot. CEB found CES to be a better predictor of loyalty than either satisfaction scores or NPS.
The question
“To what extent do you agree with the following statement: [Company] made it easy for me to handle my issue.”
Answered 1 (strongly disagree) to 7 (strongly agree).
How to calculate CES
Worked example. 5 responses: 7, 6, 5, 7, 4.
A note on the two versions
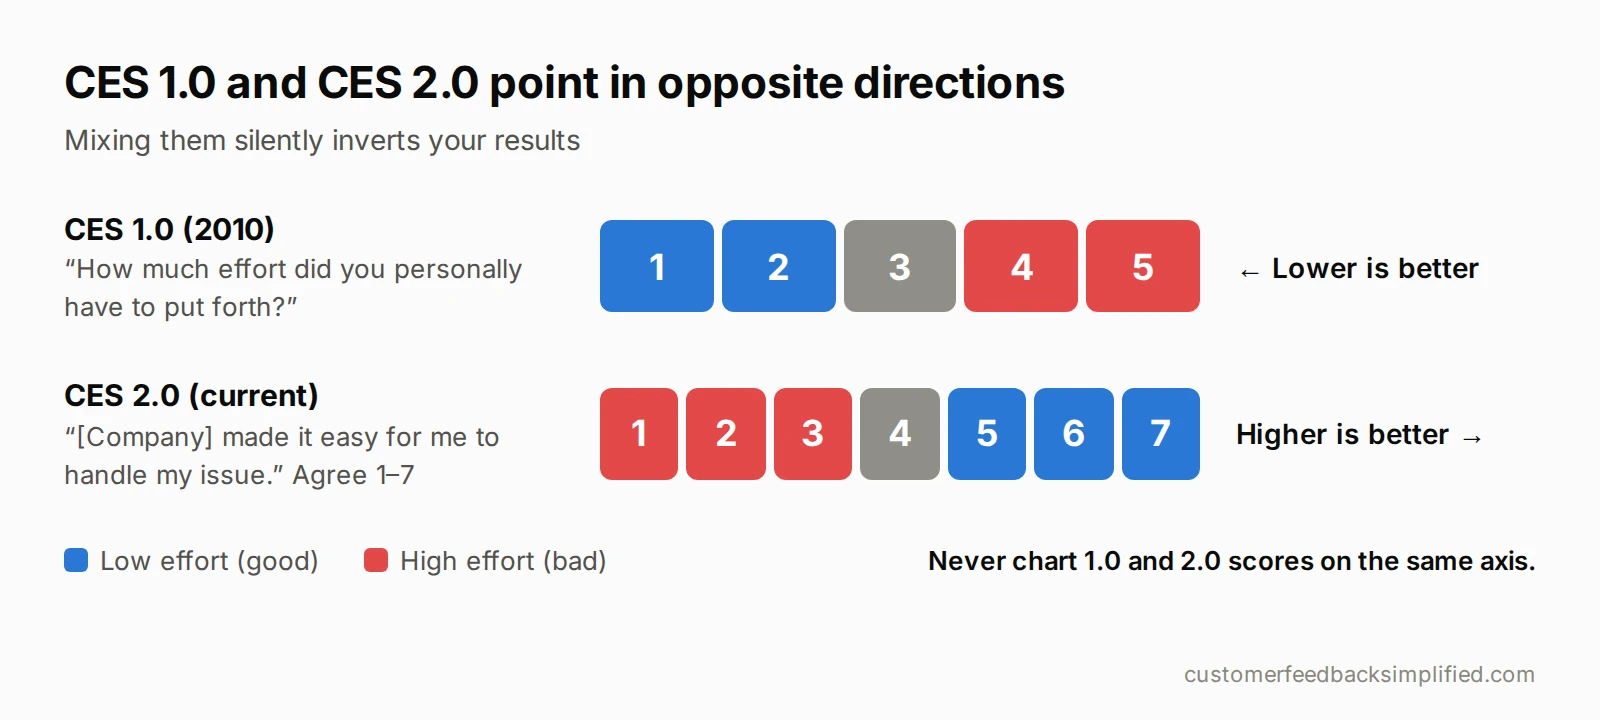
You will find two different CES formats in the wild, and mixing them up inverts your results:
- CES 1.0 (original, 2010): “How much effort did you personally have to put forth?” — 1 to 5, where low is good.
- CES 2.0 (current, recommended): the agreement statement above — 1 to 7, where high is good.
Use 2.0. It is less ambiguous for respondents and it is what benchmark data is built on. If you inherit historical CES 1.0 data, do not chart it on the same axis.
When to use CES
Straight after any interaction where the customer had to do something: resolving a support issue, returning an item, completing signup, navigating a booking. Anywhere friction could exist, CES tells you whether it did.
A low CES is an early churn signal that often appears before satisfaction scores drop at all.
Which one should you use?
If you only measure one thing, pick by the question you are actually asking:
| Your situation | Use |
|---|---|
| “Are customers loyal enough to grow us by word of mouth?” | NPS |
| “Did this specific transaction go well?” | CSAT |
| “Is our process harder than it should be?” | CES |
| “Why are customers leaving?” | CES first, then NPS verbatims |
| “Which location or team is underperforming?” | CSAT, segmented |
| “Should we invest in this product change?” | NPS trend over time |
Can you run all three?
Yes, and most mature feedback programmes do — the mistake is asking them all at once. A single survey carrying NPS, CSAT and CES will exhaust the respondent and give you three mediocre data points instead of one good one.
Map them to moments instead:
- Transaction completes → CSAT (1 question)
- Support interaction closes → CES (1 question)
- Every quarter → NPS (1 question + 1 open follow-up)
One question per moment. Response rates stay high, and each number means something specific. All three are calculated for you from the answers, so the arithmetic above is background rather than homework.
Want to see what these questions look like to your customers?
Try the interactive form builder — build an NPS, CSAT or CES question and watch the low-score follow-up appear. No sign-up.
Common mistakes
Measuring without a follow-up question.
A score with no comment tells you the temperature but not the diagnosis. One open-ended question doubles the value of every survey.
Surveying too often.
Feedback fatigue is real. A customer asked after every single interaction stops answering honestly, then stops answering.
Treating NPS as a percentage.
It is an index from −100 to +100. Reporting “an NPS of 40%” signals to anyone who knows the metric that you do not.
Comparing across industries.
A 30 means different things in cloud hosting and in retail, as the benchmark table above shows. Your own trend line comes first, your industry second.
Collecting scores nobody acts on.
The metric is not the point. The fixed process, the recovered customer, the written record of what was done — that is the point. If a low score does not reach someone who can act on it while it still matters, you are collecting decoration.
That last one is what quietly kills most feedback programmes. It is the part Customer Feedback Simplified is built around: you write the rule for what counts as a bad score, and a matching response raises a browser notification with the customer’s own words attached — no dashboard to remember to open. Whoever picks it up records what they did about it and cannot close it without saying what that was. Nothing is sent to the customer; you ring or email them however you already do, and the record is there afterwards.
Two things worth being plain about: alerts are browser notifications rather than email or SMS, and nothing notifies until you tick the box on a rule you wrote. Some businesses deliberately run no alert rules at all and still open a follow-up on any response they want to act on.
Frequently asked questions
What is the difference between NPS and CSAT?
NPS measures long-term loyalty by asking how likely someone is to recommend you, scored from −100 to +100. CSAT measures satisfaction with one specific interaction on a 1–5 scale, reported as a percentage.
NPS tracks the relationship; CSAT tracks a single moment. A customer can be delighted with Tuesday’s support ticket and still be planning to leave.
For when they disagree and how many responses each needs, see CSAT vs NPS.
Is CES better than NPS?
For predicting whether a customer will stay after a service interaction, CEB’s research found CES to be the stronger predictor. For predicting referrals and organic growth, NPS is more useful.
They measure different things, so “better” depends on the decision you are making.
What is a good NPS score for SaaS?
B2B software and SaaS averages around 41, per Retently’s 2026 benchmarks. Anything above that is above average for the sector; above 70 is exceptional in any industry.
How many responses do I need for these scores to be reliable?
Enough that a handful of responses cannot swing the number. Below roughly 100 responses, treat the figure as directional rather than precise — a single detractor moves NPS by a full point at 100 responses, and by ten points at 10.
Can I use a 1–5 scale for NPS?
No. NPS is defined on a 0–10 scale with fixed Promoter, Passive and Detractor bands. Changing the scale means your number is not NPS and cannot be compared to any benchmark.
How often should I send an NPS survey?
Quarterly is standard for most businesses, or 30–90 days after onboarding for a first measurement. More often than monthly and you are measuring survey fatigue.
More on how the product handles these — the full FAQ. Already collecting public reviews? Google Reviews vs internal feedback covers where the two differ.
Sources
- Dixon, Freeman & Toman, “Stop Trying to Delight Your Customers”, Harvard Business Review, July 2010 — hbr.org/2010/07/stop-trying-to-delight-your-customers
- Retently, “What is a Good Net Promoter Score? (2026 NPS Benchmark)” — retently.com/blog/good-net-promoter-score
- Reichheld, F., Bain & Company — origin of the Net Promoter Score, Harvard Business Review, 2003
- American Customer Satisfaction Index — theacsi.org
Last reviewed 2026-09-25. Benchmarks move; check the source before quoting one in a board pack.
Run NPS, CSAT and CES without the arithmetic
Build the questions, share them by QR code or link, and the scores are calculated as the answers arrive. Decide which answers are worth interrupting you for, and a matching response raises a browser notification with the comment attached.
Try free for 30 daysNo card required.