CSAT vs NPS: what each one tells you, and what to do when they disagree
CSAT (Customer Satisfaction Score) measures how satisfied someone was with one specific interaction, reported as a percentage. NPS (Net Promoter Score) measures how likely they are to recommend you overall, reported as a number from −100 to +100. Use CSAT to find out whether a particular moment worked. Use NPS to track whether the relationship is healthy.
Most comparisons stop there. This guide also covers what they tend to leave out: what it means when the two scores disagree, how many responses each one needs before the number means anything, and three things that quietly move the score — who you asked, what order you asked in, and what language you asked in.
At a glance
| CSAT | NPS | |
|---|---|---|
| The question | “How satisfied were you with [this order / this visit / this support call]?” | “How likely are you to recommend us to a friend or colleague?” |
| Scale | Usually 1–5 | 0–10 |
| Reported as | % of people who chose 4 or 5 | % promoters (9–10) minus % detractors (0–6) |
| Measures | One specific moment | The overall relationship |
| When to ask | Right after the moment | Every quarter, or 30–90 days into the relationship |
| Responses needed* | About 60 | About 235, roughly four times as many |
| Best for | Fixing a specific process | Tracking loyalty over time |
*For a score you can trust to within 10 points either way, with CSAT around 80% and NPS around +30. See How many responses you need.
How each one is calculated
CSAT counts only the top two answers as satisfied:
If 132 of 150 customers rate their visit 4 or 5, CSAT is 88%. A 3 counts as not satisfied. That’s deliberate: neutral customers tend to behave more like unhappy ones than happy ones.
NPS sorts answers into three groups and subtracts:
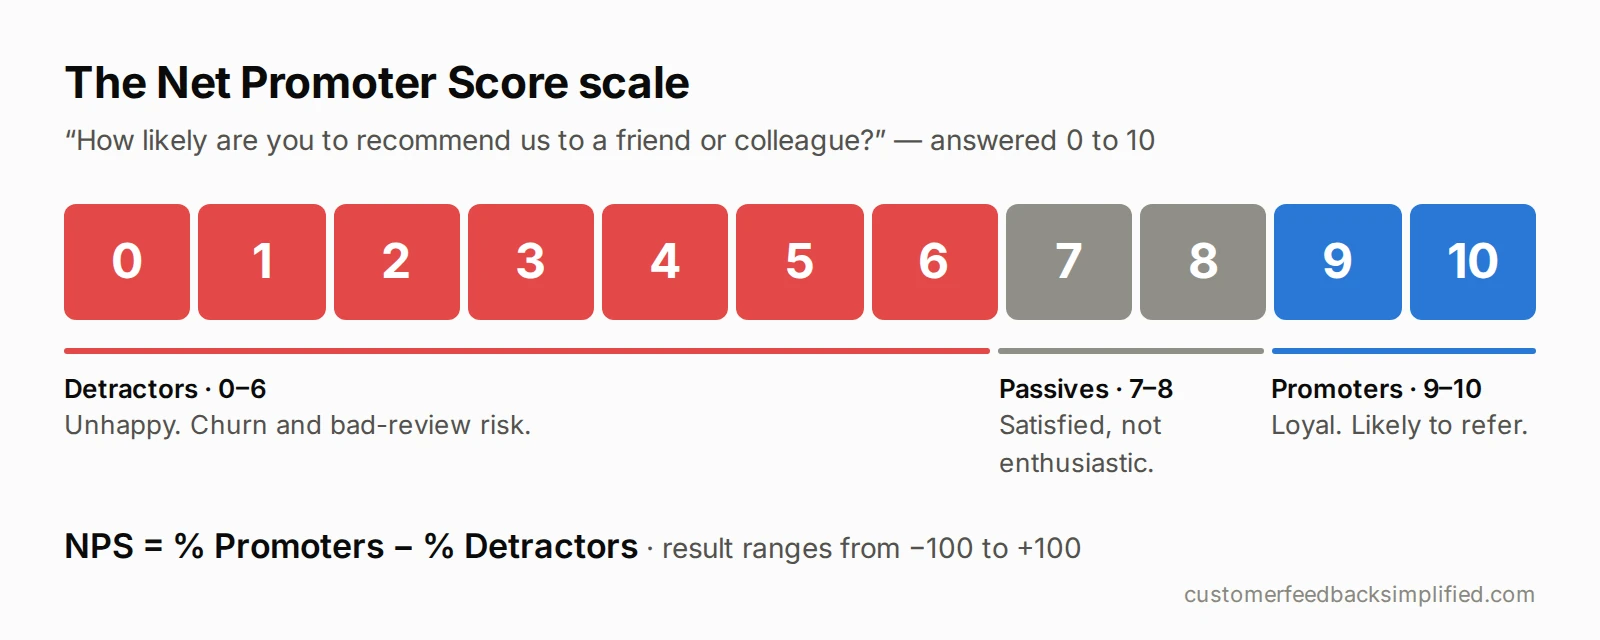
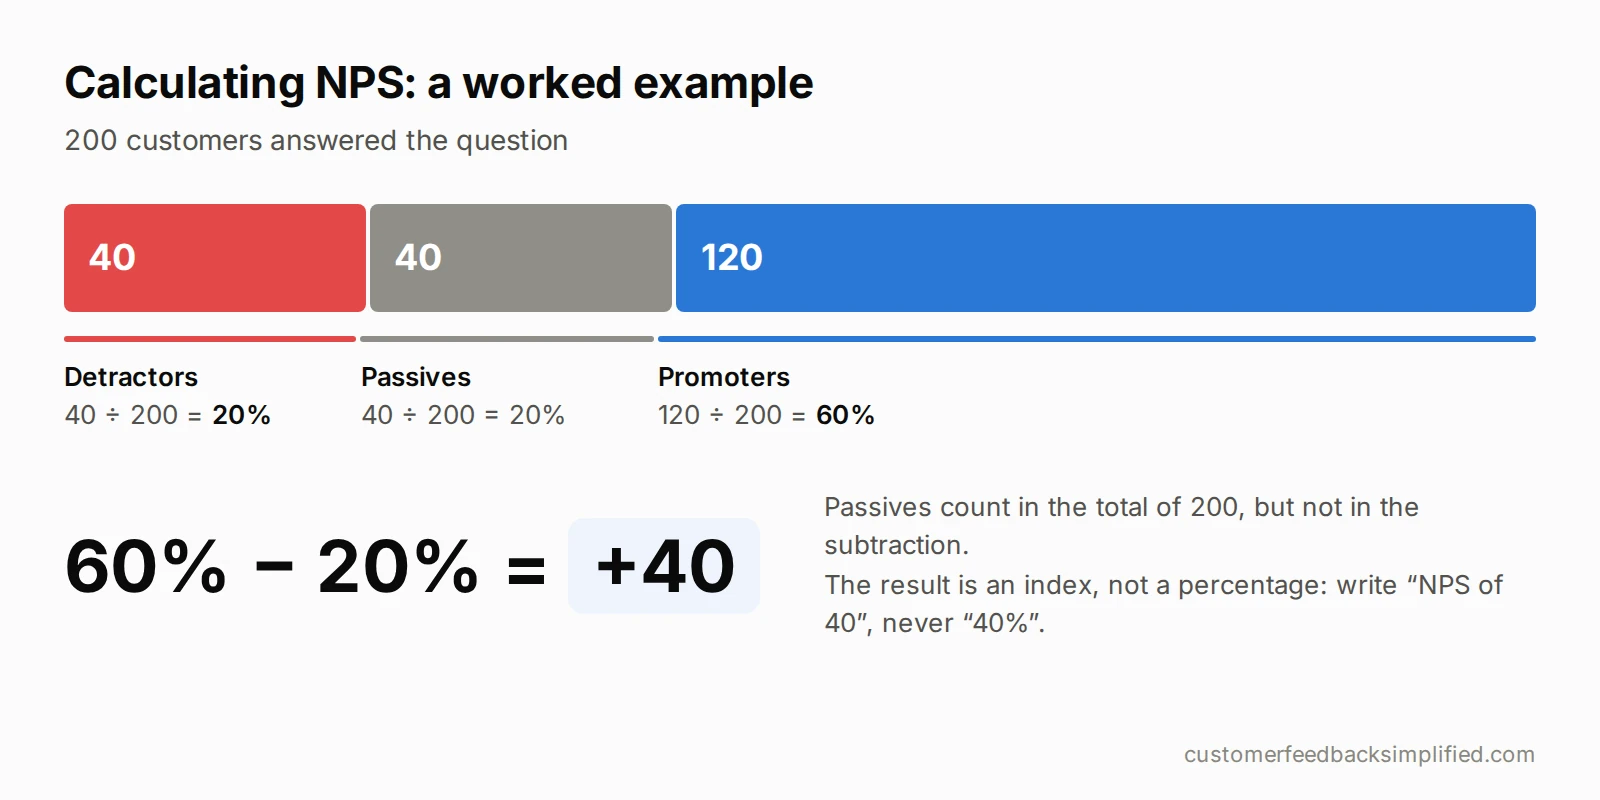
Passives count in the total but not in the subtraction. The result is an index, so write “an NPS of 40”, never “40%”.
For formulas, benchmarks and Customer Effort Score as well, see NPS vs CSAT vs CES.
When CSAT and NPS disagree
Disagreement between the two scores is common, and it’s the most useful thing these two metrics can tell you together. They measure different things at different moments, so a gap between them tells you where the problem is.
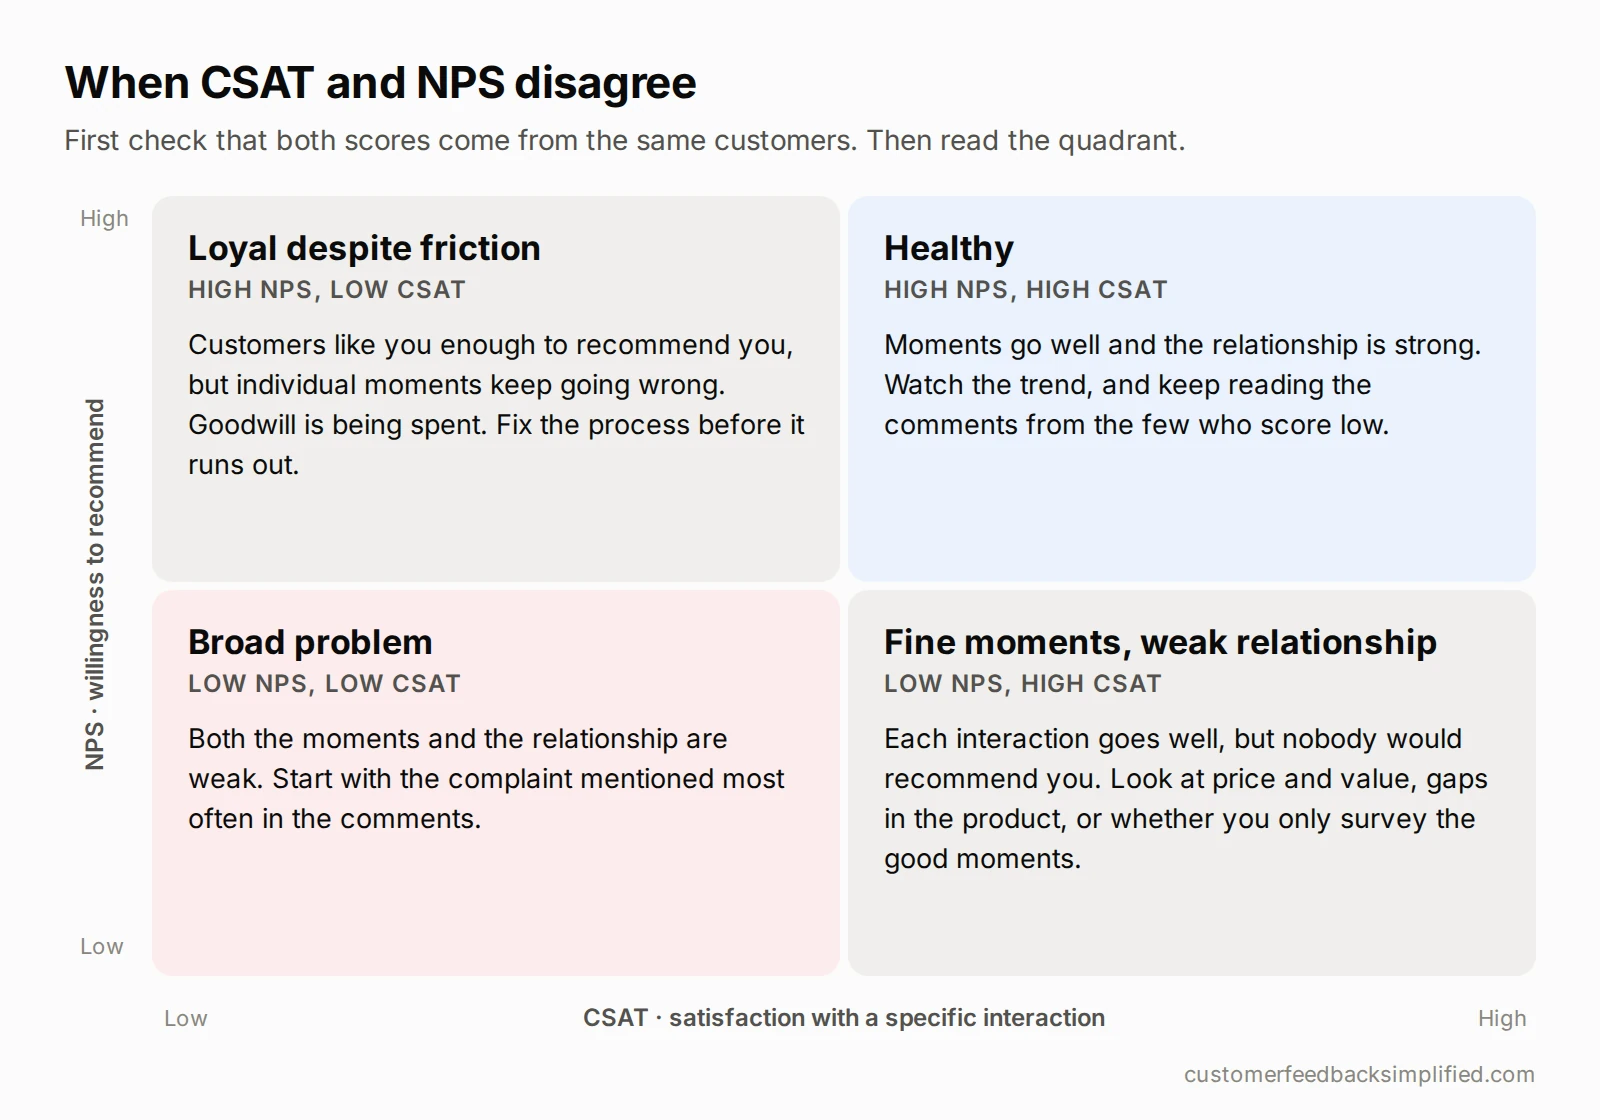
First check: are both scores from the same customers?
Before you read anything into a gap, check who answered each survey. It’s the most common cause of an apparent disagreement, and the easiest to miss.
- The surveys often go to different people. A support CSAT goes only to people who contacted support. A quarterly NPS goes to your whole customer list. Say your support CSAT is 92% from 150 people and your NPS is +12 from 400 people. Those two numbers mostly describe different groups, and comparing them tells you very little.
- The trigger decides who gets asked. If CSAT fires when a ticket is marked resolved, the tickets that were never resolved are never surveyed. Your CSAT then describes the problems you fixed.
- Neither survey reaches people who already left. The customers with the most to say are often the ones no longer on your list.
- People with strong feelings are more likely to answer. Your scores come from the people who answered, and those people may not represent the rest.
How to check: tie each response to a customer, then compare NPS among customers who also answered a CSAT survey with NPS among those who didn’t. If the two groups differ a lot, you were never comparing like with like.
High CSAT, low NPS: fine moments, weak relationship
An illustrative example. A restaurant runs a table QR survey after each meal and gets 88% CSAT over a month. Its quarterly NPS is +5 (35% promoters, 35% passives, 30% detractors). Every meal seems to go fine, yet almost nobody would recommend the place.
Things to check, in order:
- You may only be surveying the moments that usually go well. If you ask about the meal but not the booking, the wait or the bill, a problem at those points shows up in NPS and never in CSAT. Add a CSAT question at a moment you don’t currently measure.
- Value for money. A customer can be satisfied with a meal and still think it wasn’t worth the price. CSAT rarely picks this up; NPS usually does.
- Nothing memorable. “Fine” doesn’t get recommended. High CSAT with a lot of passives often means nothing was wrong, but nothing stood out either.
- Competitors are just as good. When every option is satisfactory, loyalty is weak even though satisfaction is high.
Then read the comments from your passives and detractors specifically. That’s where the reason usually is.
Low CSAT, high NPS: loyal despite friction
An illustrative example. A school’s parents rate the fees office poorly (58% CSAT), but the school’s NPS is +42. Parents love the teaching and put up with the admin.
This quadrant is the easiest one to ignore, and that makes it risky. The loyalty is real, but each bad interaction uses some of it up. When the friction finally shows up in NPS, it usually shows up late and all at once. Fix the process, and track that touchpoint’s CSAT every month so you can see the fix working.
Both high, or both low
Both high: moments go well and the relationship is strong. Keep measuring the trend, and keep reading the comments from the few who score low.
Both low: the problem isn’t one moment. Start with the complaint that comes up most often in the comments. It’s usually the one causing the most damage.
Is the gap even real?
With small numbers of responses, two scores can appear to disagree purely by chance. Read the next section before acting on a gap between them.
How many responses you need
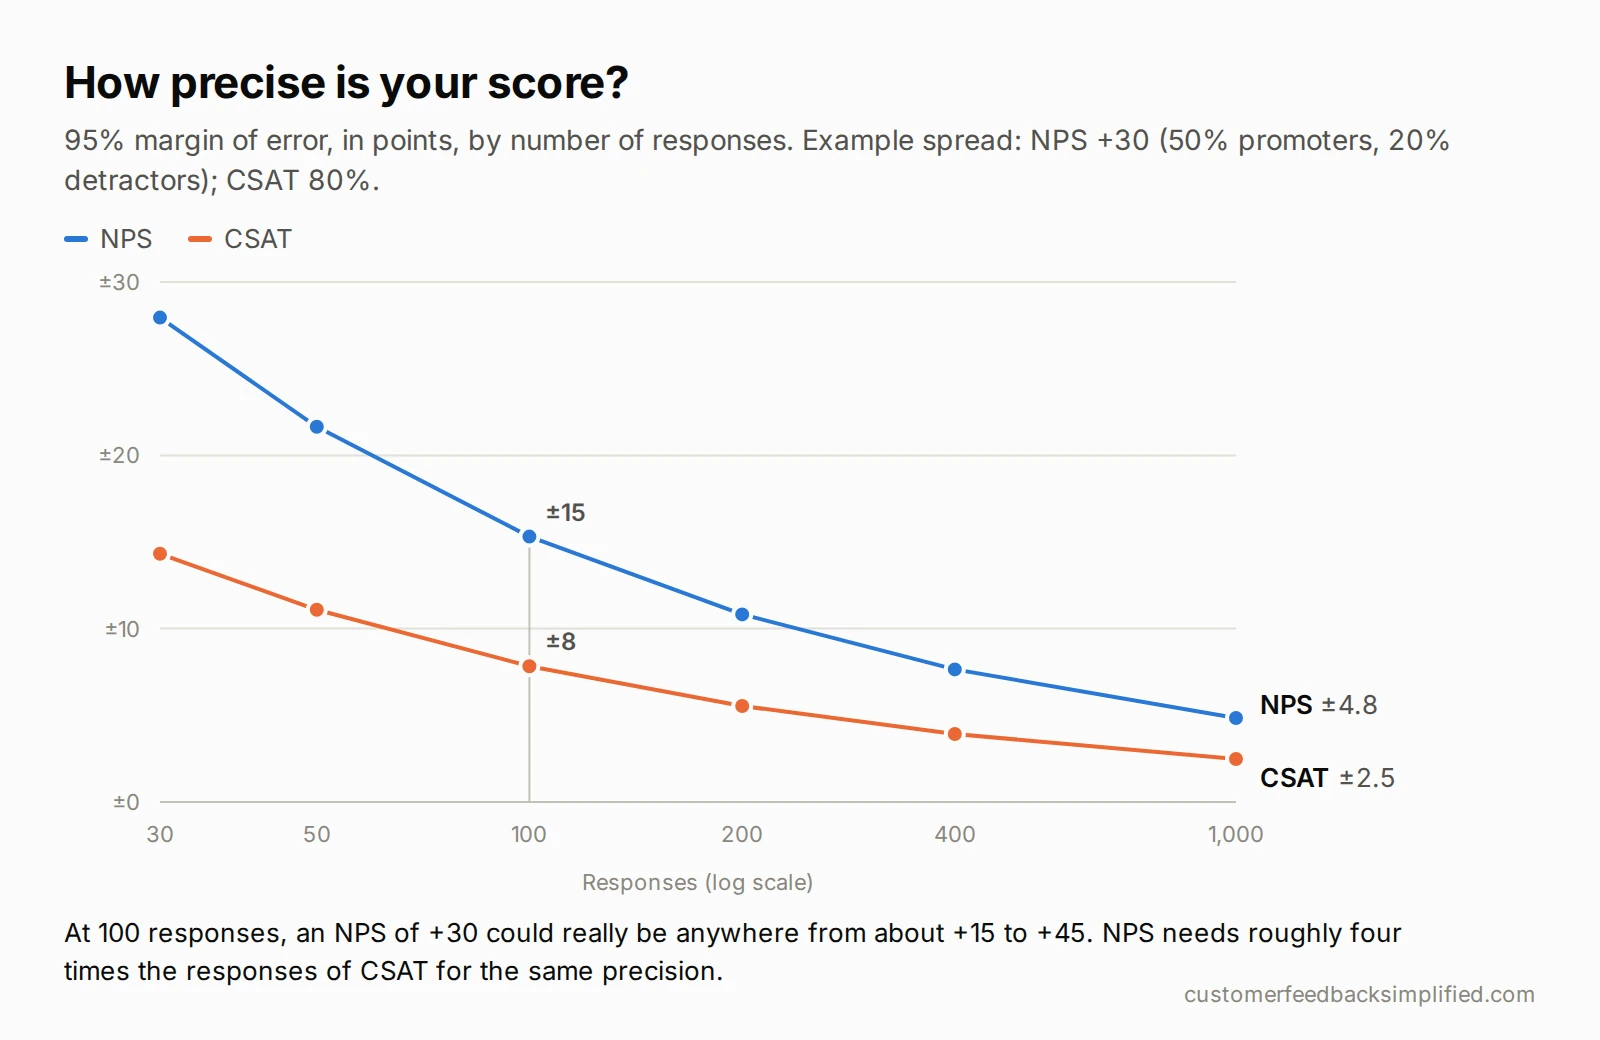
Every score is an estimate from the customers who answered. The fewer answers you have, the more the score moves around for no reason. It’s rarely mentioned, and it matters most to small businesses.
| Responses | CSAT (around 80%) | NPS (around +30) |
|---|---|---|
| 30 | ±14 points | ±28 points |
| 50 | ±11 | ±22 |
| 100 | ±8 | ±15 |
| 200 | ±6 | ±11 |
| 400 | ±4 | ±8 |
| 1,000 | ±2.5 | ±5 |
95% margin of error. Assumes CSAT around 80%, and NPS of +30 from 50% promoters and 20% detractors. Different spreads give somewhat different numbers.
What this means in practice:
- NPS needs roughly four times as many responses as CSAT for the same precision. NPS is one percentage minus another, and it throws away the middle of the scale, so it moves more with each answer.
- At 100 responses, an NPS of +30 could really be anywhere from about +15 to +45. Treat it as a range, not a point.
- Most month-to-month changes are noise. Say NPS goes from 32 to 40, with 100 responses each month. The 8-point rise is well inside the uncertainty, which is about ±22 points for the difference between two such months. It isn’t evidence that anything changed.
- For a ±10-point NPS you need about 235 responses at this spread. For ±5, about 940. For CSAT, about 60 and 250.
If you get fewer than about 200 responses a period, start with CSAT. It gives you a usable number sooner. Add NPS when you can collect enough answers, or combine a quarter’s responses into one NPS reading instead of reporting it monthly.
The formulas, for anyone who wants to run their own numbers:
NPS margin ≈ 1.96 × √( (P + D − (P − D)²) ÷ n ) × 100
p is the share who chose 4 or 5; P and D are the shares of promoters and detractors, written as fractions (0.5, not 50%); n is the number of responses. These are standard approximations, fine from about 30 responses upward.
Asking both in one survey: question order changes the answers
If you ask a specific question before a general one, the first answer shapes the second. In survey research on part-whole questions, Schwarz, Strack and Mai (1991) found that when people answered a specific question first, their answer to the general question shifted: either towards the specific answer, or deliberately away from it when they treated the general question as “everything else”. When several specific questions come first, the general question tends to be answered as a summary of them.
CSAT is the specific question and NPS the general one, so:
- If you ask both in one survey, ask NPS first, then CSAT.
- If your survey asks five questions about the visit and then asks NPS, your NPS is partly a summary of those five questions, not an independent read of the relationship.
- Keep the order fixed. Changing it breaks your trend line, because the old and new numbers were measured differently.
Better still, ask each at its own moment: CSAT right after the interaction, NPS separately and less often.
Language and culture shift the scores, and NPS most of all
People from different countries use rating scales differently, whatever their actual opinion. In a 26-country study, Harzing (2006) found large differences in how often people choose the extreme ends of a scale, the middle, or simply agree, linked to cultural characteristics of each country. The language of the questionnaire mattered too: English-language versions drew more middle answers, and native-language versions drew more extreme ones.
The study wasn’t about NPS, but NPS is especially exposed to this effect. It counts only 9 and 10 as positive. A group of customers who avoid the ends of a scale will produce fewer promoters without being any less loyal. CSAT’s “4 or 5 out of 5” depends less on the extreme end.
If you survey in more than one language or country:
- Compare each language version with its own history, not with the others. A Hindi NPS and an English NPS from the same business may differ because of how people answer, not how they feel.
- Start a new trend line when you add a language, rather than folding it into the existing one.
- Be careful with published NPS benchmarks if your customers answer in a different language or live in a different country from the benchmark’s source data.
Can you convert CSAT into NPS?
No. They ask different questions on different scales about different things. A customer can rate a meal 5 out of 5 and still answer 6 when asked whether they’d recommend the restaurant. There’s no reliable formula between the two. If you need an NPS, ask the NPS question.
What the research says about NPS
NPS was introduced by Frederick Reichheld in Harvard Business Review in 2003 as “the one number you need to grow”, on the claim that it predicted company growth better than other measures.
That claim has been tested. Keiningham and colleagues (2007, Journal of Marketing) used longitudinal data from 21 firms and more than 15,500 interviews from the Norwegian Customer Satisfaction Barometer. They could not replicate the claim that NPS is clearly superior to other measures, including customer satisfaction, at predicting growth.
The practical takeaway: NPS is useful because it’s simple, standardised and widely understood. That’s a real advantage when you want a number your whole team tracks the same way. It isn’t a reason to drop satisfaction measures in favour of NPS. We make a tool that measures both, so we have no reason to favour either one.
Which should you start with?
| Your situation | Start with |
|---|---|
| Fewer than about 200 responses per period | CSAT, at your one or two most important moments |
| You want to know whether a specific process works | CSAT |
| You want to track the overall relationship, and can collect 200+ responses a quarter | NPS |
| Customers are leaving and you can’t see why | Both, tied to the same customers, so you can compare |
| Any of the above | One open follow-up question, such as “What’s the main reason for your score?” |
The score tells you something is off. The comment tells you what.
Frequently asked questions
Is NPS better than CSAT?
Neither is better; they measure different things. CSAT tells you whether a specific interaction went well. NPS tells you how the overall relationship is doing. Peer-reviewed research hasn’t shown NPS to predict growth better than satisfaction measures. Choose based on the question you need answered and how many responses you can collect.
Can CSAT be high while NPS is low?
Yes, and it’s common. Usually each interaction goes fine but nothing makes customers want to recommend you, or you only survey the moments that tend to go well. First check that both scores come from the same customers.
Can I convert CSAT to NPS?
No. They use different questions and scales, and no reliable formula links them. If you need an NPS, ask the NPS question.
How many responses do I need for a reliable NPS?
About 235 for a margin of ±10 points, and about 940 for ±5, when your NPS is around +30. At 100 responses, expect about ±15 points. NPS needs roughly four times as many responses as CSAT for the same precision.
Should I ask CSAT and NPS in the same survey?
It’s better to ask them at separate moments. If you ask both together, ask NPS first and CSAT second, because a specific question asked first shifts the answer to a general one. Keep the order the same every time.
What’s a good CSAT compared with a good NPS?
There’s no reliable cross-industry CSAT benchmark; compare against your own history at the same touchpoint. NPS benchmarks exist by industry, and they’re listed in our NPS vs CSAT vs CES guide.
Do CSAT and NPS work in languages other than English?
Yes, but scores from different languages aren’t directly comparable. People answer rating scales differently across cultures and languages, and NPS is the most affected. Track each language against its own history.
Sources
- Reichheld, F. F. (2003). “The One Number You Need to Grow.” Harvard Business Review.
- Keiningham, T. L., Cooil, B., Andreassen, T. W., & Aksoy, L. (2007). “A Longitudinal Examination of Net Promoter and Firm Revenue Growth.” Journal of Marketing, 71(3) — doi.org/10.1509/jmkg.71.3.039
- Harzing, A.-W. (2006). “Response Styles in Cross-national Survey Research: A 26-country Study.” International Journal of Cross Cultural Management — doi.org/10.1177/1470595806066332
- Schwarz, N., Strack, F., & Mai, H.-P. (1991). “Assimilation and Contrast Effects in Part-Whole Question Sequences: A Conversational Logic Analysis.” Public Opinion Quarterly, 55(1), 3–23.
- Margin-of-error figures: calculated for this page with the standard normal approximation shown above.
Last reviewed 2026-09-25.
Run CSAT and NPS at the right moments, tied to the right customers
Customer Feedback Simplified lets you ask CSAT and NPS at separate moments. It ties each response to its location, and to the customer when your form asks who they are, so you can check whether both scores come from the same people. Both scores are calculated as the answers arrive, and when a response matches a rule you set, a browser notification arrives with the customer’s comment attached.
No card required.